

Star Trek: Strange New Worlds has shown its popularity by appearing on Nielsen’s top streaming chart throughout the second season, now wrapping it up with one last appearance.
Top 10 season
The Nielsen top 10 original streaming program chart for the week of August 6 – 13 released today includes Star Trek: Strange New Worlds. This chart week included the release of the season 2 finale “Hegemony.” SNW ranked at #10 with 304 million minutes viewed. This was a drop from the previous week (with the release of the musical episode “Subspace Rhapsody”) where the show was ranked at #7 with 362 million minutes viewed. But the show ends its season continuing to compete closely with shows on more popular streaming services like Prime Video and Hulu.
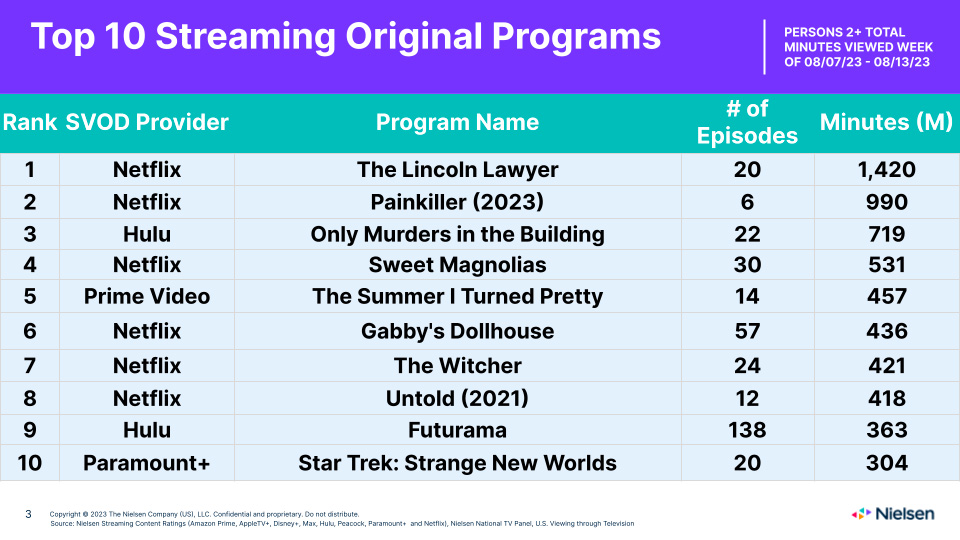
This is the seventh time Strange New Worlds has ranked on the Nielsen chart for the nine weeks of its season 2 run (which includes one week with two episodes released). Earlier in the year, Star Trek: Picard ranked on the same chart three times during its 10-week run. Since Nielsen started measuring Paramount+ data earlier this year, only the two Star Trek shows and the Yellowstone prequel 1923 have appeared on the original top 10 chart.

Martin Quinn as Scotty in Star Trek: Strange New Worlds “Hegemony” (Paramount+)
Bonus video – making “Hegemony”
Here is a behind-the-scenes package about the making of the season 2 finale.
Keep up with news about the Star Trek Universe at TrekMovie.com.


For those keeping score at home…
6/12/23-6/18/23: 338 million minutes
6/19/23-6/25/23: 393
** not in top 10**
7/3/23-7/9/23: 351
**not in top 10**
7/17/23-7/23/23: 324
7/24/23-7/30/23: 395
7/31/23-8/6/23: 362
8/7/23-8/13/23: 309
I read somewhere that you can divide these millions of minutes totals by the episode runtime to get a millions of viewers per episode estimate. For instance, if you just average out these totals, it’s about 353 million minutes per episode, and if you figure the average episode runtime is 52 minutes, then that’s about 6.79 million viewers per episode. That’s right in the American Idol-Survivor-Law & Order: SVU range, which would be in linear TV’s top 30 for scripted shows. That’s pretty great. Especially when you consider the reach of Paramount+ versus the networks and other streamers.
Star Trek fans have been showing up, and new fans as well. I’m sure a number of them can be attributed to repeat viewings, of course. Of all the terrible decisions being made at Paramount these days, you gotta hand it to them for investing in their “family jewels” as the old exec put it, because Star Trek is the only thing that streamer has going for it (except I guess Yellowstone or whatever)
Disagree. Netflix? What’s that? The Yellowstone franchise is a juggernaut.
Some of the previous CBS broadcast shows moved to Par+, like the EXCELLENT season of Criminal Minds: Evolution. Evil is excellent.
Star Trek is one of the things it has going for it, not the only thing, especially with Showtime now added to the mix.
Star Trek is definitely important, but the Yellowstone franchise is huge for P+, and it might become an even bigger factor if they can pump out more (like the new Kevin Costner-less spinoff). “1923” showed up on the streaming chart the week of February 27, 2023 with 560M minutes. It only showed up once for the season finale because that was the first week Nielsen measured P+. I believe “1923” is still the biggest premiere that P+ has had, so that 560M minutes might not even have been its biggest week if it had been measured prior to the finale.
I would think a lot of fans rewatch the new episodes several times in the same week. I know I do for the ones I enjoyed, like the musical. I am sure that increases the count.
Part of the problem with the metrics used to measure streaming is that you don’t necessarily get a clear view of just how many unique viewers are actually watching and how repeat viewers may actually be skewing those total minutes viewed when numbers are provided by Nielsen and others. The streamers have the actual numbers, however, and when shows are cancelled by Netflix and others, there are very clear reasons why when it comes to viewership.
What’s telling is when you add all streamed content to the mix and how some of the shows above drop out of the top 10. “Suits”, which went off the air back in 2019, dominated all entire summer as well as other “evergreen” series which still outperform their new streaming counterparts.
Measuring streaming data is still a work in progress and we don’t get a clear picture of how a show is actually performing until someone leaks data. Amazon, for example, touted “Rings of Power” as landing in the Top 20 for 2023 only to have it later revealed that just 37% of U.S. viewers actually completed the series with 45% doing so internationally. In the linear world of old, that leads to a quick and painful cancellation announcement several weeks into the shows run. In short, a lot of the numbers just don’t add up. What SNW does have in its favor is consistent performance throughout the season (with Picard actually rising each week through its finale).
Slow and steady wins the race and what SNW deserves is a platform which allows it to reach more viewers.
That can give you an estimated number of views, not viewers. And that’s only assuming all the minutes were from that week’s episode. While most minutes probably were the newest episode, a good amount could be from any of the other episodes already out at that time.
Isn’t there an online campaign going designed to get S3 of Picard back into the top ten?